Jump past navigation
Village of Wilson
About
Terms of Service
Privacy Policy
Employment
Calendar
History
Meetings
Contact
Departments
Government
Boards & Committees
Economic Development (GRANTS)
Emergency Management
Code Of Village of Wilson
Community
Climate Smart Community
Wander About Wilson
Waiver
Events
Pay Your Bills Online
Water Bill (Village only NOT Town)
Property Tax (Village ONLY not Town/County or School)
Miscellaneous VILLAGE ONLY (verify with clerk if unsure)
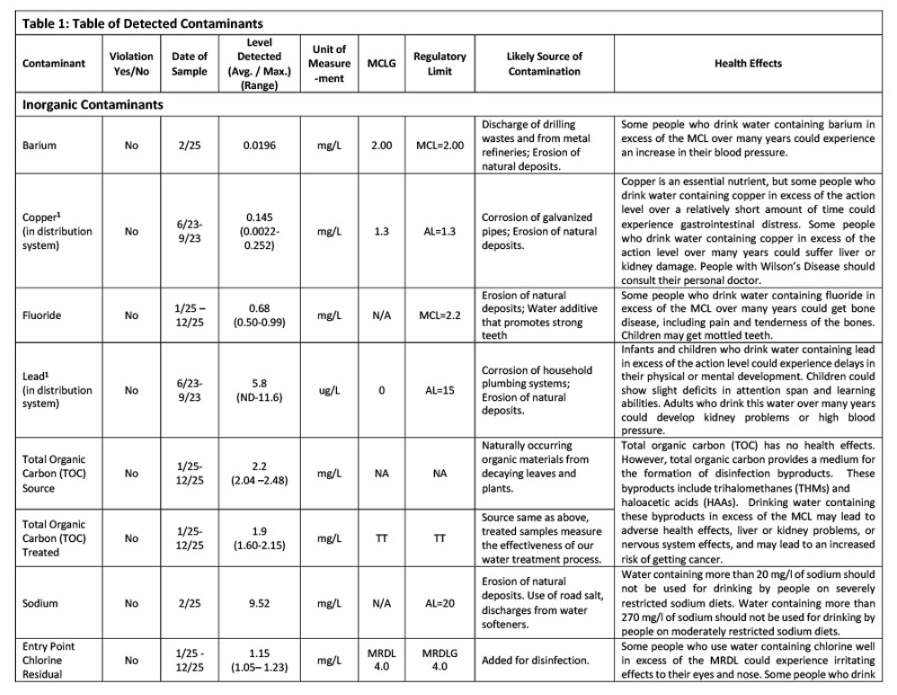
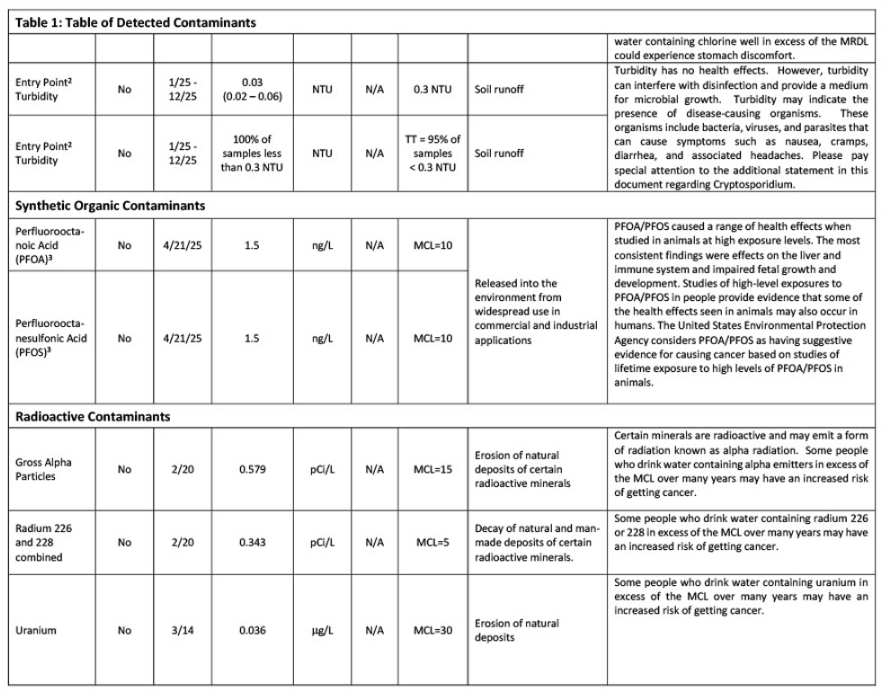
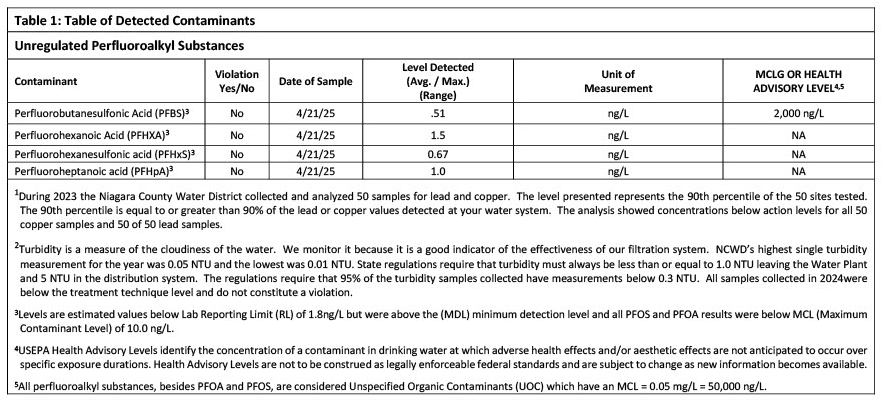
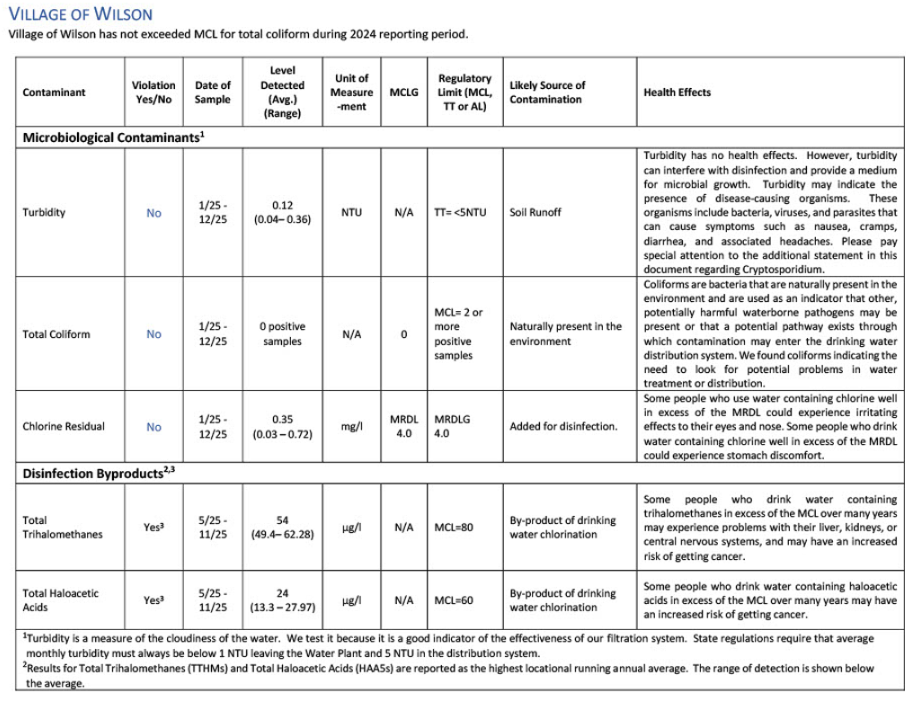
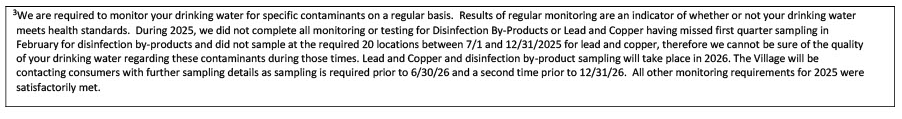
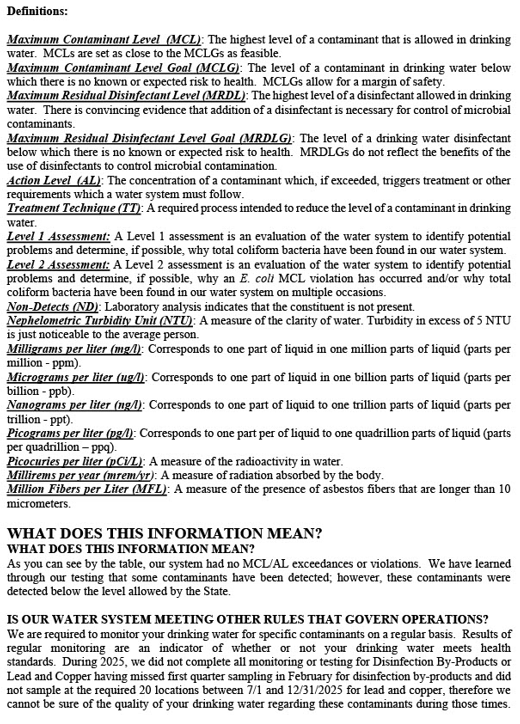
Annual Water Quality Report
Annual Water Quality Report